📰 Trending Topics
Google News - Trending
Why birthright citizenship is trending - CNN
2026-04-01 19:40
Trending tickers: Micron, Unilever, Raspberry Pi and AG Barr - Yahoo Finance UK
2026-03-31 08:41
Google News - Technology
Download these ‘Apple at 50’ wallpapers for iPhone, iPad, and Mac - 9to5Mac
2026-04-01 20:14
- Download these ‘Apple at 50’ wallpapers for iPhone, iPad, and Mac 9to5Mac
- One of Apple’s First Employees Looks Back at 50 Years The New York Times
- Five key questions Apple faces entering its second half-century CNBC
- Apple is turning 50! Remember the iPhone launch in 2007? Lines, hype and big questions KOCO
- The Mystery of Steve Jobs New York Magazine
Tim Cook explores rare iPod, iPhone prototypes in new interview [Video] - 9to5Mac
2026-04-01 18:43
- Tim Cook explores rare iPod, iPhone prototypes in new interview [Video] 9to5Mac
- Tim Cook checks out Apple's archive, containing items he's not seen before AppleInsider
- Tim Cook Says iPhone Launch Was His Favorite Apple Moment in 50th Anniversary Interview MacRumors
- Watch: WSJ shares an intimate look at unseen prototypes that help tell the story of 50 years of Apple history MacDailyNews
- Tim Cook Discovers Apple's Own Past in a Private Archive Tour with Rarely Seen Prototypes TechEBlog -
Samsung Galaxy S26 Ultra Review - IGN
2026-03-31 15:57
- Samsung Galaxy S26 Ultra Review IGN
- Why It’s Time To Leave The iPhone vs Samsung Debate In The Past | by Mark Ellis | Mac O’Clock | Mar, 2026 Medium
- I like some of Samsung's innovations on the Galaxy S26 Ultra — but here's why I'm sticking with my iPhone TechRadar
- Galaxy S26 vs iPhone 17 Speed Test: There’s a new king of mobile performance Geeky Gadgets
- ACCIDENTAL AUDIENCES: Over A Quarter of Brits Admit to Looking at A Stranger’s Phone Screen in Public Out of Sheer Curiosity samsung.com
Google Photos app launches on Samsung TVs – here’s what it can do - 9to5Google
2026-04-01 16:45
- Google Photos app launches on Samsung TVs – here’s what it can do 9to5Google
- Google Photos lands on Samsung TVs Android Police
- Samsung TV Is Finally Getting Google Photos, but There’s a Small Caveat SammyGuru
- Google Photos arrives on Samsung TVs as a hybrid app with Daily+ integration The Tech Portal
- New alliance between Samsung and Google integrates cloud photos into televisions with artificial intelligence mixvale.com.br
Super Meat Boy 3D Review - IGN
2026-04-01 20:58
- Super Meat Boy 3D Review IGN
- Super Meat Boy doesn't really work as a 3D platformer polygon.com
- The most difficult game of all time is back. Super Meat Boy 3D reviews are out IXBT.games
- How Long to Beat Super Meat Boy 3D? games.gg
- Super Meat Boy 3D launch trailer – tough-as-nails 3D platformer comes to Nintendo Switch 2 Nintendo Everything
NASA - Breaking News
Réunion Island Lava Reaches the Sea
2026-04-02 04:01
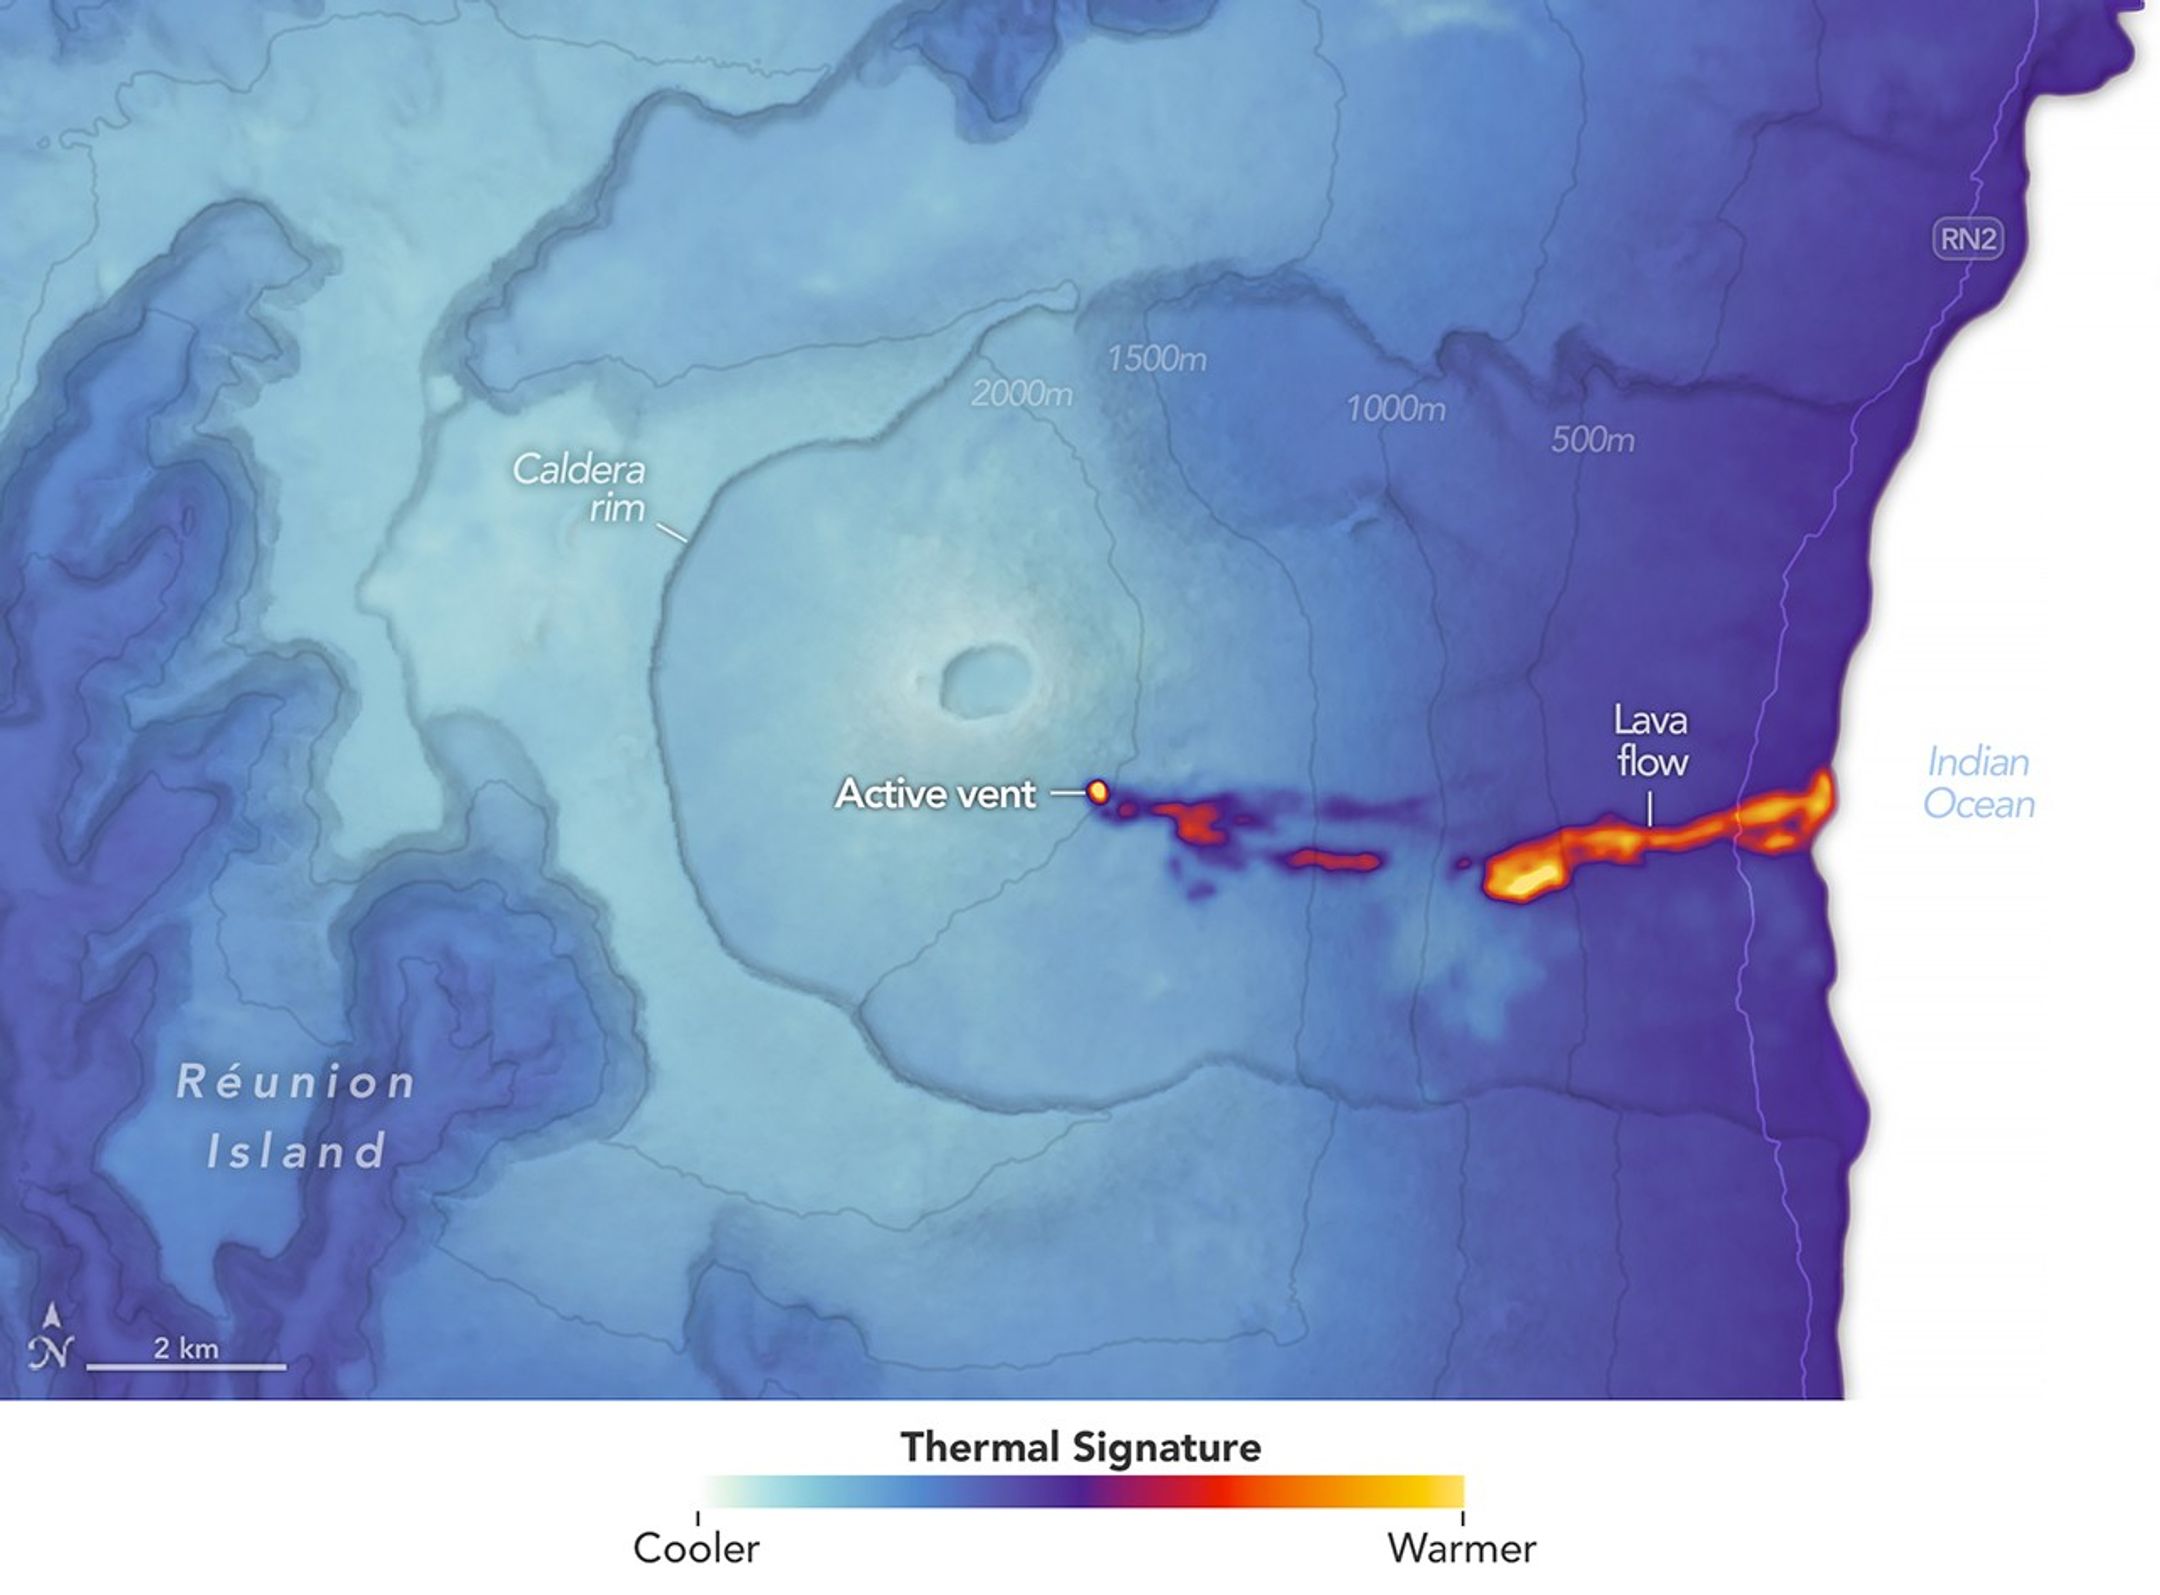
Located 700 kilometers (440 miles) east of Madagascar, Réunion Island is the product of a long-lived mantle hotspot on the floor of the Indian Ocean. The island first emerged above the ocean’s surface about 2 million years ago. It remains active today, with frequent eruptions from Piton de la Fournaise, a shield volcano on the island’s eastern side.
Since the 17th century, the volcano has had more than 150 documented eruptions. The most recent began within the Enclos Fouqué caldera on February 13, 2026, with the opening of four fissures that fueled sustained lava fountains reaching 10 to 50 meters (30 to 160 feet). Throughout February and March, basaltic lava spilled down the volcano, advancing through forested and grassy areas toward its eastern side.
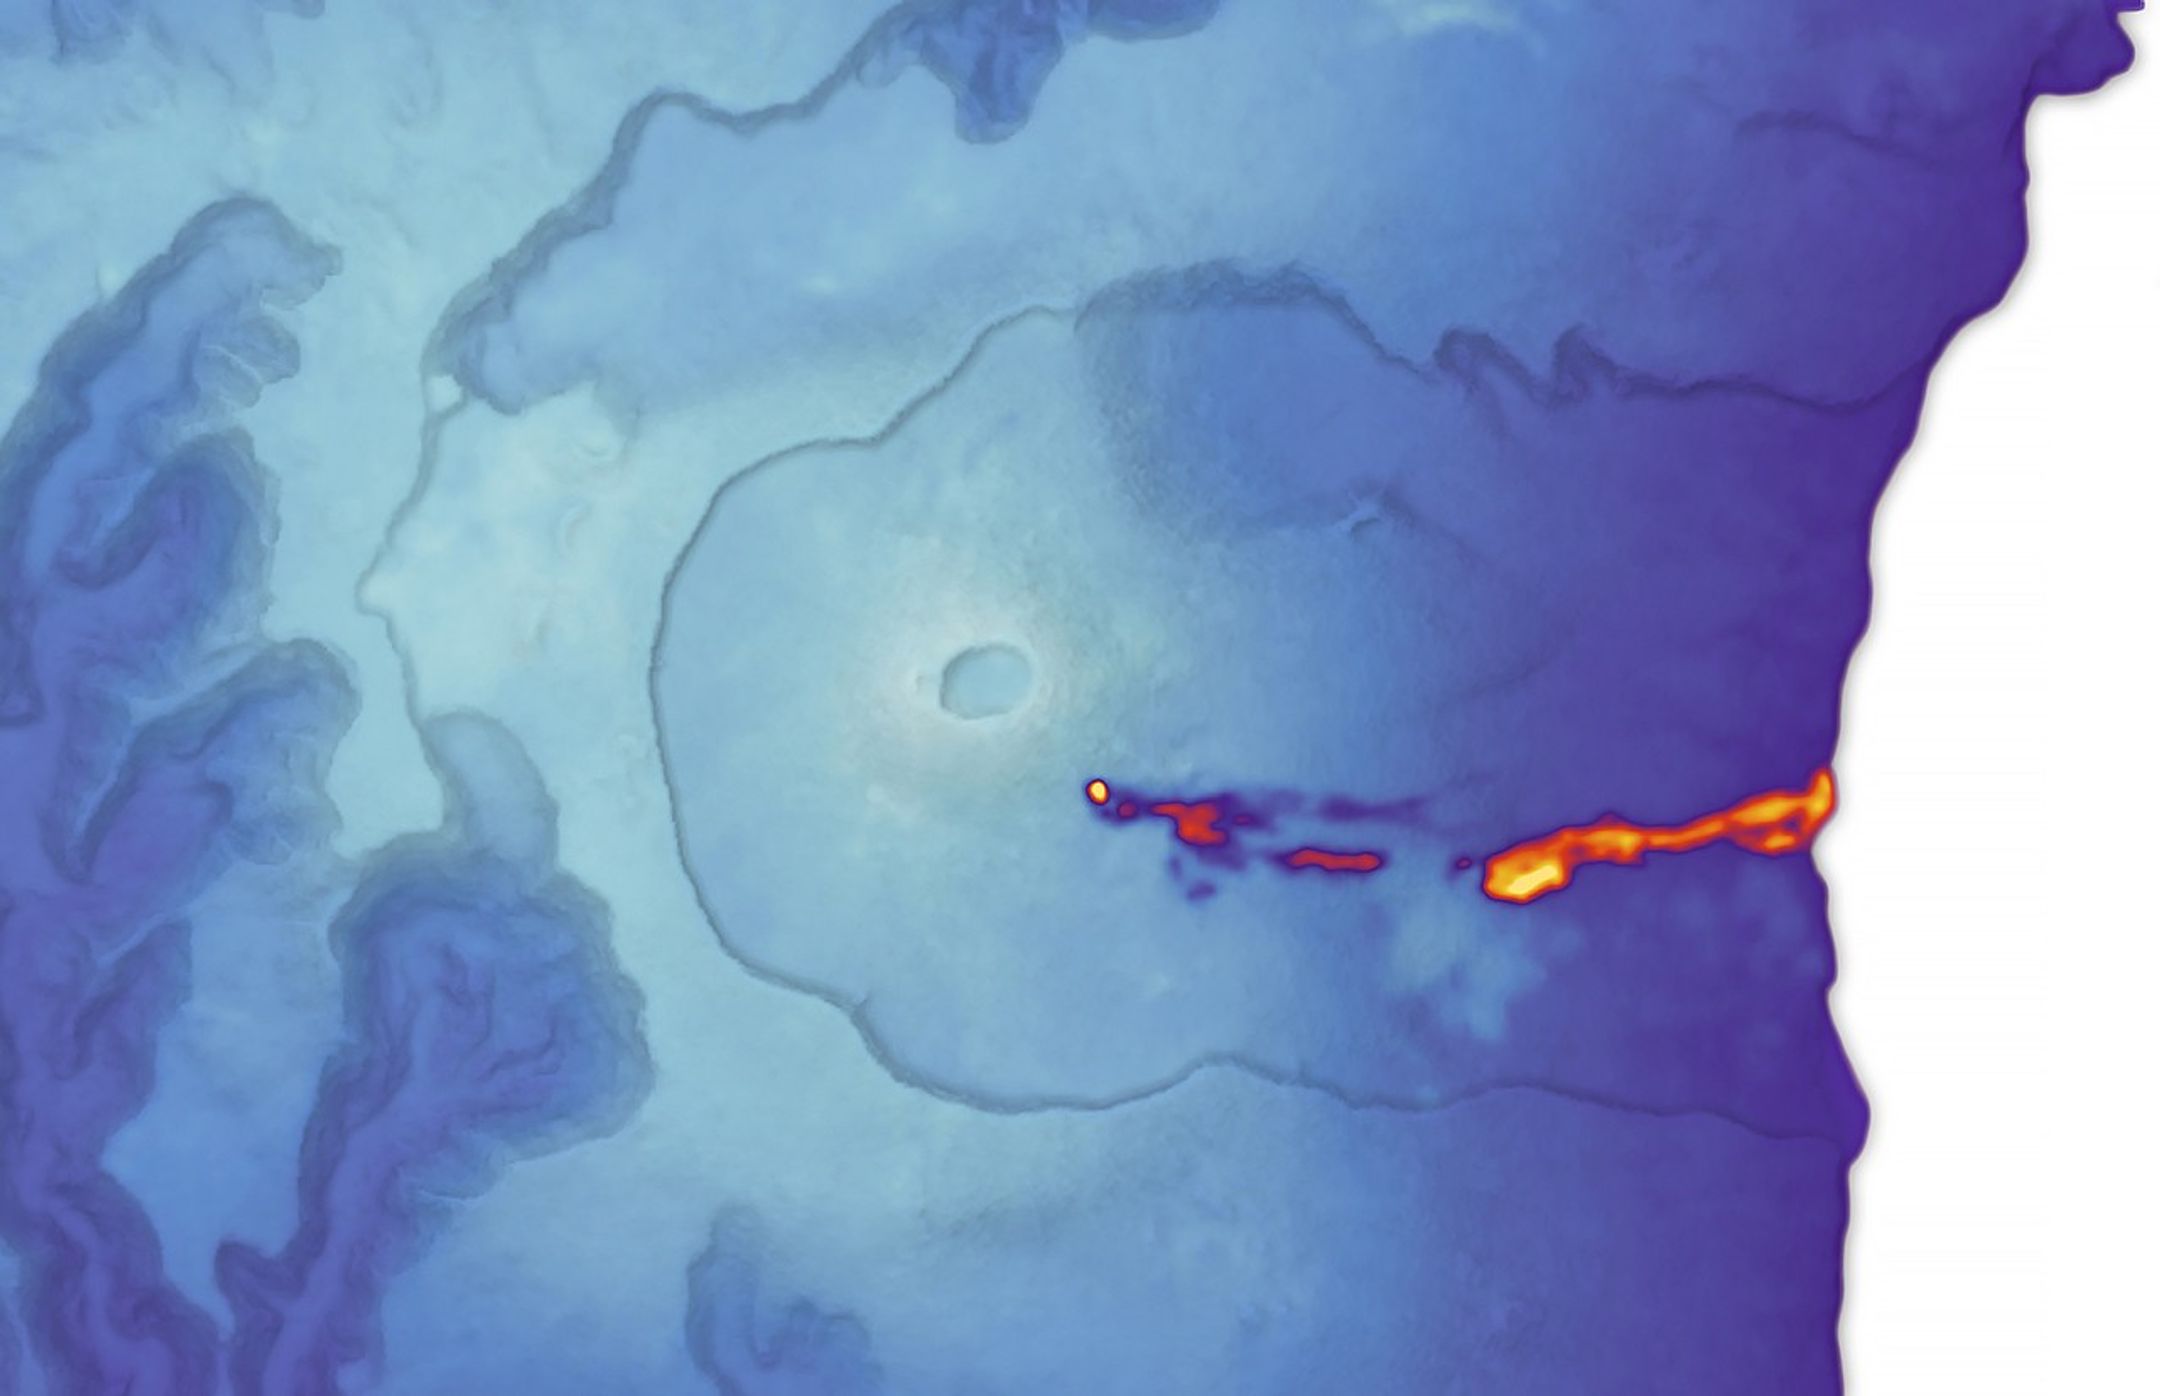
This thermal satellite image shows lava flowing east toward the ocean on March 28, 2026. The signal reveals the amount of heat emanating from surfaces on Earth based on detections of thermal radiation in two wavelengths. Warmer areas are mapped in yellow and cooler surfaces in blue. The thermal data were overlaid on a digital elevation model of the island.
The current activity likely marks the onset of a new cycle of frequent eruptive activity at Piton de la Fournaise
Diego Coppola
University of Turin
“The hottest areas, shown as the brightest tones, correspond to the eruptive vent, the active lava channel, and the flow front,” said Adele Campus, a University of Turin volcanologist. From the vent, lava flows downslope for several kilometers, often through lava tubes. “The places where lava re-emerges at the surface through breakouts appear as localized hotspots,” she added. Campus and colleagues analyzed more than two decades of NASA and NOAA satellite observations in a 2025 study, identifying key trends and patterns in the volcano’s thermal activity and rate of lava effusion.
On March 13, lava cut through the island’s Route Nationale 2 (RN2). By March 16, it had begun to spill into the Indian Ocean, producing acidic plumes of steam and volcanic gases, known as laze, according to the Observatoire Volcanologique du Piton de la Fournaise (OVPF). Scientists on the ground measured lava temperatures of 1,100 to 1,130 degrees Celsius (2,010 to 2,070 degrees Fahrenheit) as lava neared the ocean. Thermal surveys also showed that water temperatures exceeded 36°C (97°F) up to 600 meters from the entry point, according to OVPF. As of March 24, materials entering the ocean had created a new lava delta that extended the coastline by 190 meters.
“This eruption appears to be longer and to have produced a larger volume of lava than usual,” said Diego Coppola, a professor of volcanology at the University of Turin who coauthored the analysis with Campus. Such characteristics are often associated with the onset or end of an eruptive cycle. The most recent cycle began in 2014, culminated in 2015, and ended in July 2023. “The current activity,” he said, “likely marks the onset of a new cycle of frequent eruptive activity at Piton de la Fournaise.”
NASA Earth Observatory image by Michala Garrison, using Landsat data from the U.S. Geological Survey and elevation data from the Shuttle Radar Topography Mission (SRTM). Story by Adam Voiland.
References & Resources
- Airbus Space, via X (2026, March 25) Réunion island’s volcanic heart ignites once again. Accessed April 1, 2026.
- BBC (2026, March 16) Watch: Reunion resident gets close to lava from erupting volcano. Accessed April 1, 2026.
- Global Volcanism Program (2026) Piton de la Fournaise. Accessed April 1, 2026.
- Imaz Press (2026, March 13) [Photos-Vidéos] Volcan : trois coulées traversent la route nationale 2, la lave à environ 600 mètres de l’océan. Accessed April 1, 2026.
- MSN (2026, March 25) Reunion volcano lava reaches ocean for first time in 19 years. Accessed April 1, 2026.
- NASA Earth Observatory (2023, December 30) Snow Peak, Réunion Island. Accessed April 1, 2026.
- Observatoire volcanologique du Piton de la Fournaise, via Bluesky (2026) Posts. Accessed April 1, 2026.
- Observatoire volcanologique du Piton de la Fournaise (2026) Communiqués et bulletins. Accessed April 1, 2026.
You may also be interested in:
Stay up-to-date with the latest content from NASA as we explore the universe and discover more about our home planet.
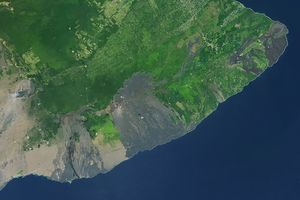
The volcano in Hawaii is one of the most active in the world, and NASA tech makes it easier for…

Episode 43 of the Hawaiian volcano’s current eruption was marked by high lava fountains and widespread ash dispersal.

The volcano on Russia’s Kamchatka Peninsula continues to erupt after centuries of quiescence.


Liftoff! NASA Launches Astronauts on Historic Artemis Moon Mission
2026-04-01 23:44

Spurred by American ingenuity, astronauts on NASA’s Artemis II mission are in flight, preparing for the first crewed lunar flyby in more than 50 years.
NASA’s SLS (Space Launch System) rocket lifted off from Launch Pad 39B at the agency’s Kennedy Space Center in Florida at 6:35 p.m. EDT Wednesday, sending four astronauts aboard the Orion spacecraft on a planned test flight around the Moon and back.
“Today’s launch marks a defining moment for our nation and for all who believe in exploration. Artemis II builds on the vision set by President Donald J. Trump, returning humanity to the Moon for the first time in more than 50 years and opening the next chapter of lunar exploration beyond Apollo. Aboard Orion are four remarkable explorers preparing for the first crewed flight of this rocket and spacecraft, a true test mission that will carry them farther and faster than any humans in a generation,” said NASA Administrator Jared Isaacman. “Artemis II is the start of something bigger than any one mission. It marks our return to the Moon, not just to visit, but to eventually stay on our Moon Base, and lays the foundation for the next giant leaps ahead.”
The successful launch is the beginning of an approximately 10-day mission for NASA astronauts Reid Wiseman, Victor Glover, Christina Koch, and CSA (Canadian Space Agency) astronaut Jeremy Hansen. As the first crewed mission of NASA’s Artemis program, among its objectives, the flight will demonstrate life support systems for the first time with crew and lay the foundation for an enduring presence on the Moon ahead of future missions to Mars.
After reaching space, Orion deployed its solar array wings, enabling the spacecraft to receive energy from the Sun, while the crew and engineers on the ground immediately began transitioning the spacecraft from launch to flight operations to start checking out key systems.
“Artemis II is a test flight, and the test has just begun. The team that built this vehicle, repaired it, and prepared it for flight has given our crew the machine they need to go prove what it can do,” said NASA Associate Administrator Amit Kshatriya. “Over the next 10 days, Reid, Victor, Christina, and Jeremy will put Orion through its paces so the crews who follow them can go to the Moon’s surface with confidence. We are one mission into a long campaign, and the work ahead of us is greater than the work behind us.”
About 49 minutes into the test flight, the SLS rocket’s upper stage fired to put Orion into an elliptical orbit around Earth. A second planned burn by the stage will propel Orion, which the crew named “Integrity,” into a high Earth orbit extending about 46,000 miles beyond Earth. After the burn, Orion will separate from the stage, flying free on its own.
In several hours, a ring on the rocket’s upper stage, which will be a safe distance away from the spacecraft, will deploy four CubeSats – small satellites from Argentina’s Comisión Nacional de Actividades Espaciales, German Aerospace Center, Korea AeroSpace Administration, and Saudi Space Agency – to perform scientific investigations and technology demonstrations.
The spacecraft will remain in high Earth orbit for about a day, where the crew will conduct a manual pilot demonstration to test Orion’s handling capabilities. The astronauts, with Mission Control Center teams at NASA’s Johnson Space Center in Houston, will continue checking spacecraft systems.
If all systems remain healthy, mission controllers will give Orion’s European-built service module a command to conduct the translunar injection burn on Thursday, April 2. This move is an approximately six-minute firing to send the spacecraft on a trajectory that will simultaneously carry crew around the Moon, while also harnessing lunar gravity to slingshot them back to Earth.
During a planned multi-hour lunar flyby on Monday, April 6, the astronauts will take photographs and provide observations of the Moon’s surface as the first people to lay eyes on some areas of the far side. Although the lunar far side will only be partially illuminated during the flyby, the conditions should create shadows that stretch across the surface, enhancing relief and revealing depth, ridges, slopes and crater rims that are often difficult to detect under full illumination. Crew observations and other human health scientific investigations during the mission, such as AVATAR, will inform science during future Moon missions.
Following a successful lunar flyby, the astronauts will return to Earth and splash down in the Pacific Ocean.
As part of Golden Age of innovation and exploration, NASA will send Artemis astronauts on increasingly difficult missions to explore more of the Moon for scientific discovery, economic benefits, and to build on our foundation for the first crewed missions to Mars.
Follow the latest mission progress, including more images from the test flight, visit:
https://www.nasa.gov/mission/artemis-ii/
-end-
Bethany Stevens / Rachel Kraft
Headquarters, Washington
202-358-1100
bethany.c.stevens@nasa.gov / rachel.h.kraft@nasa.gov
Share
Details
Related Terms
March of the Harmattan
2026-04-01 04:00

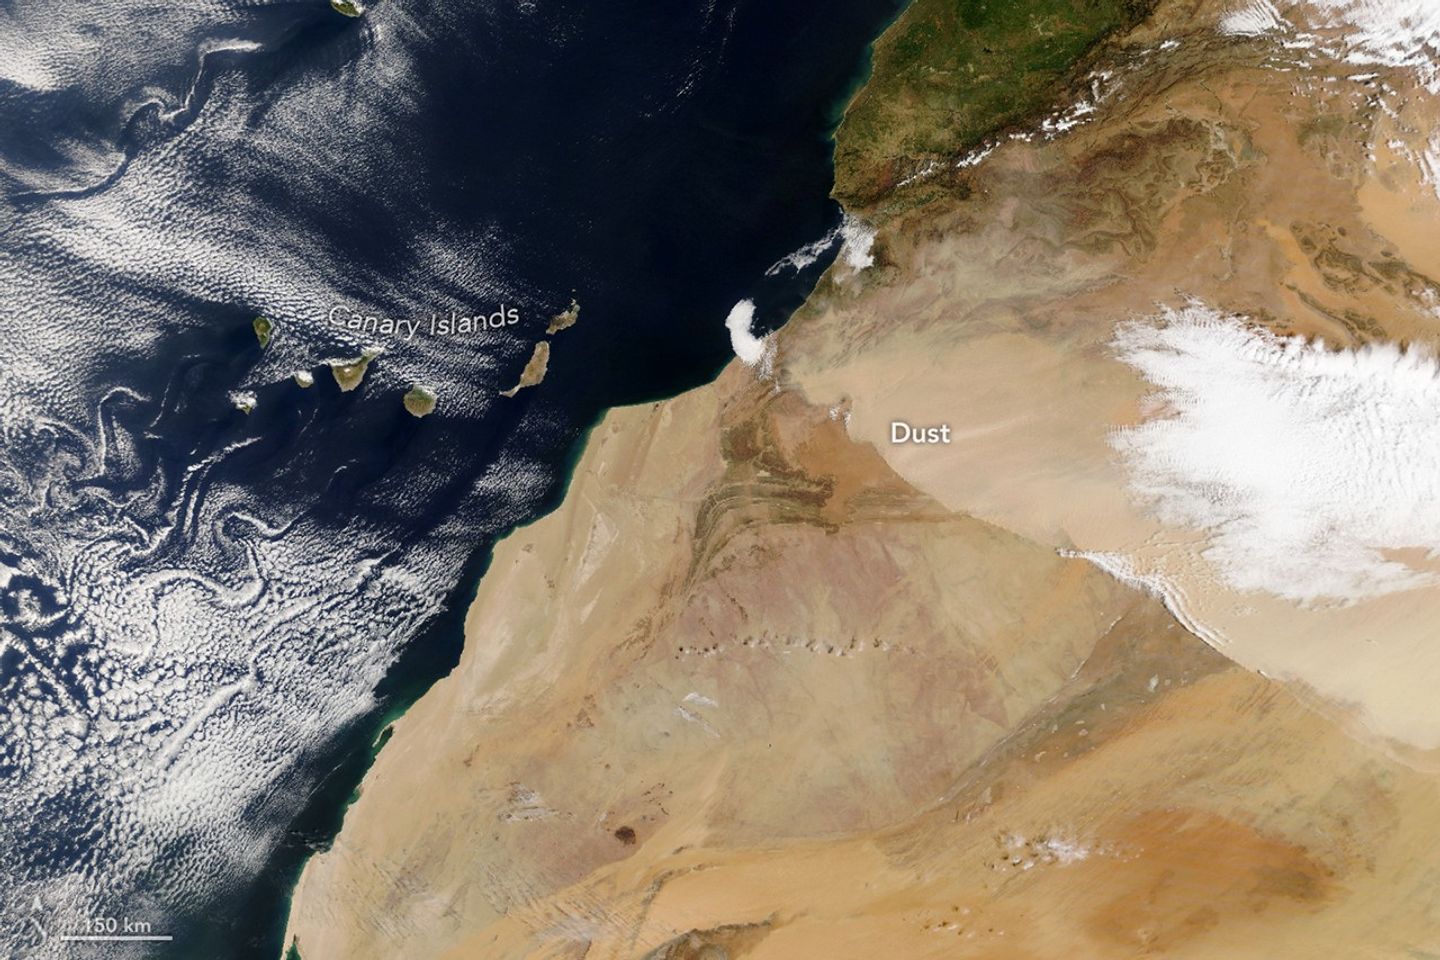

Morning
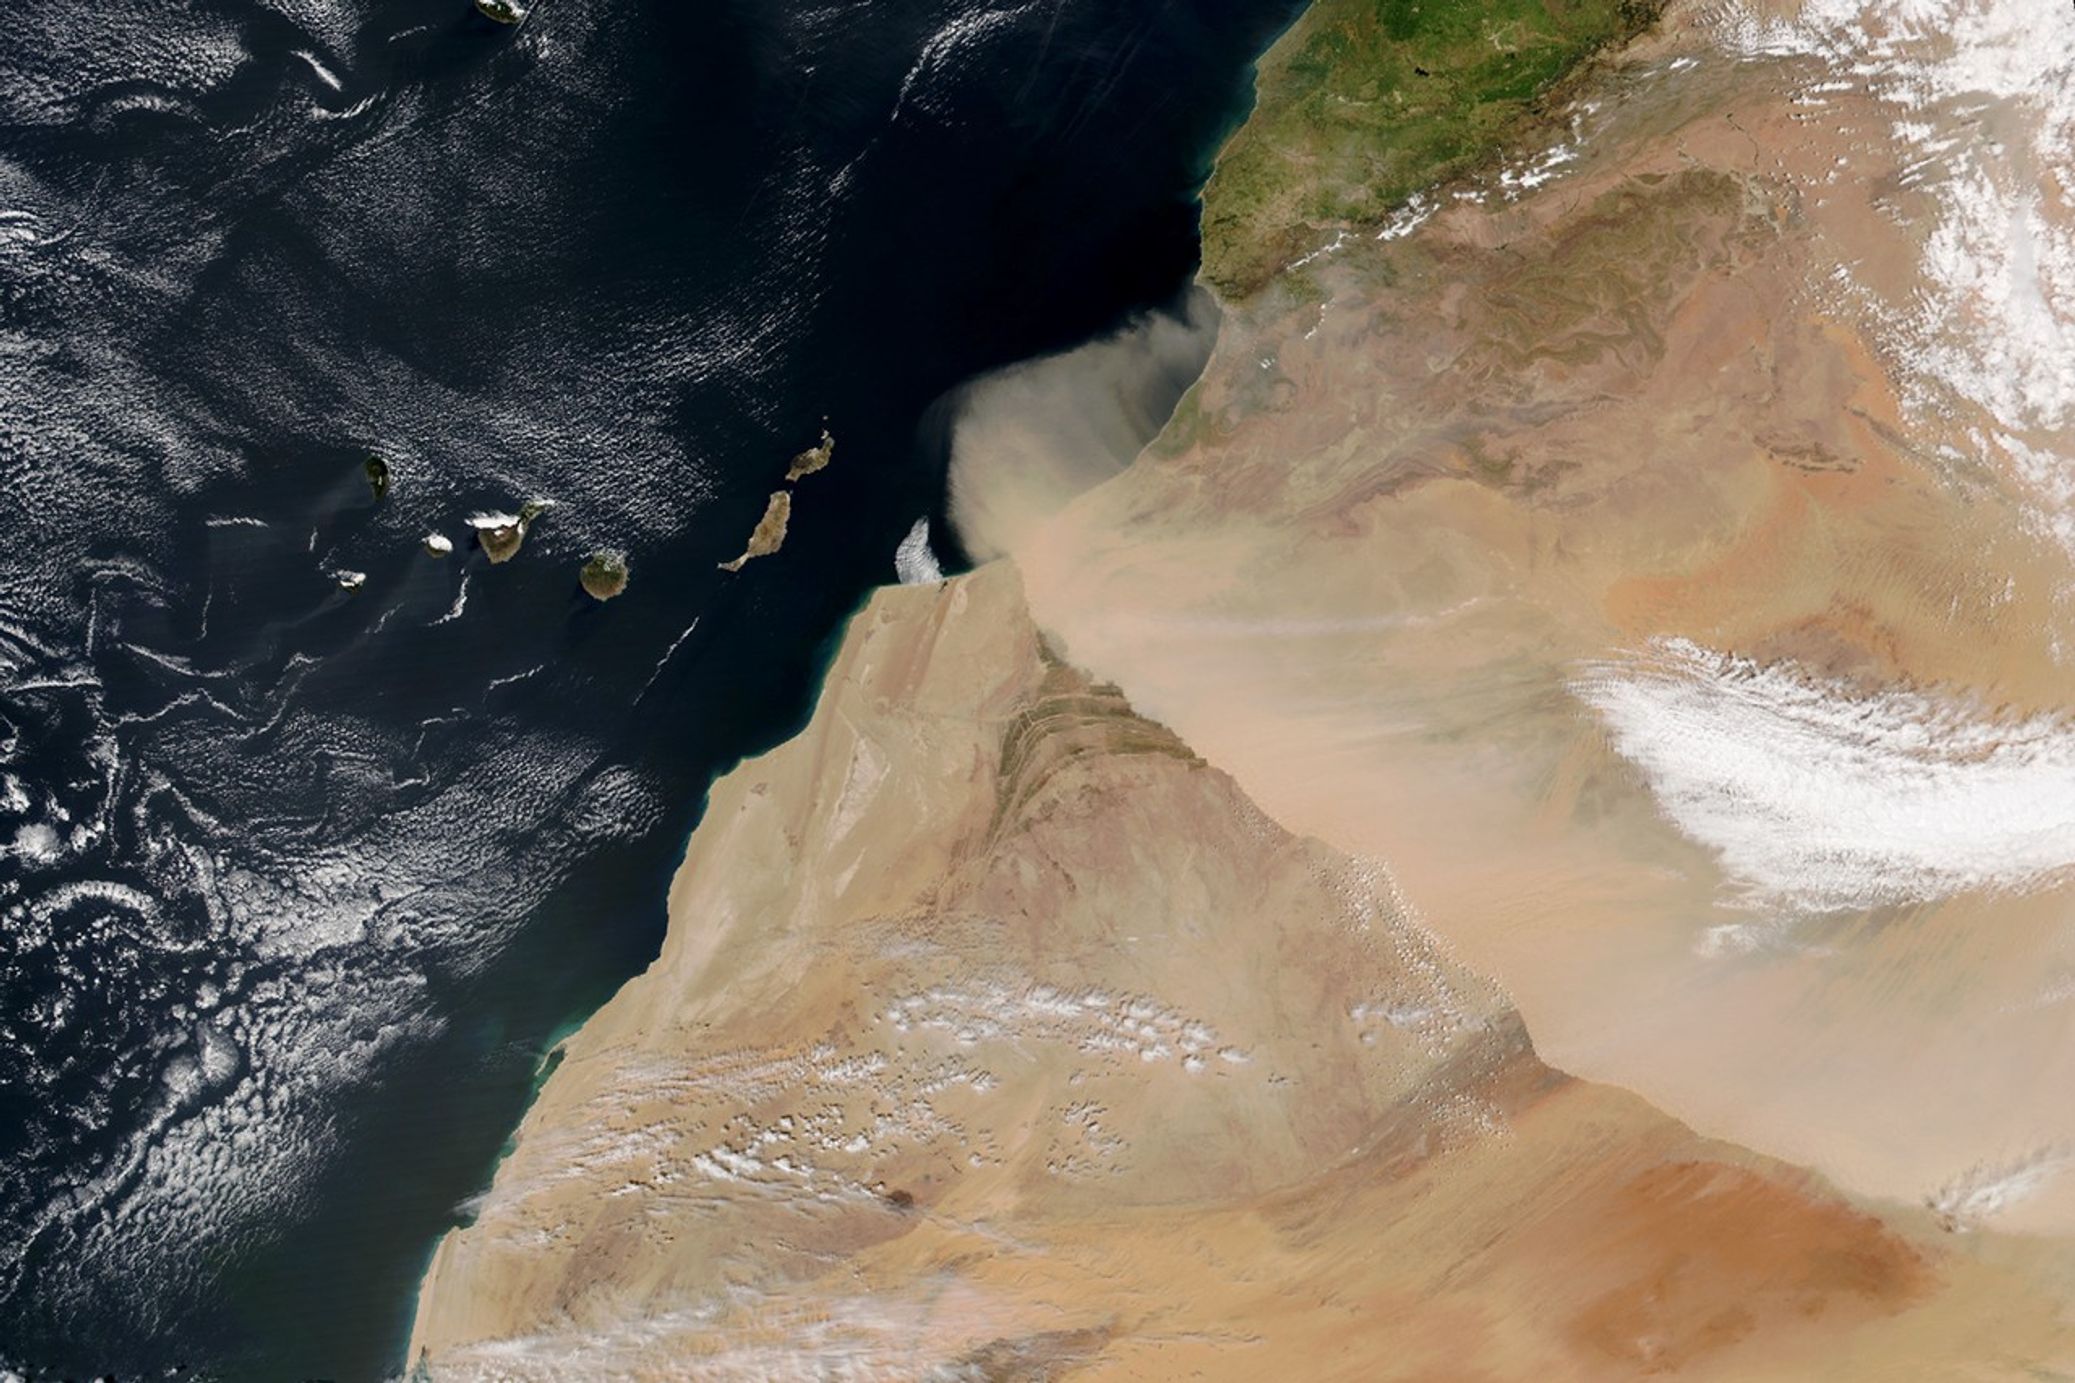
Afternoon
March 30, 2026
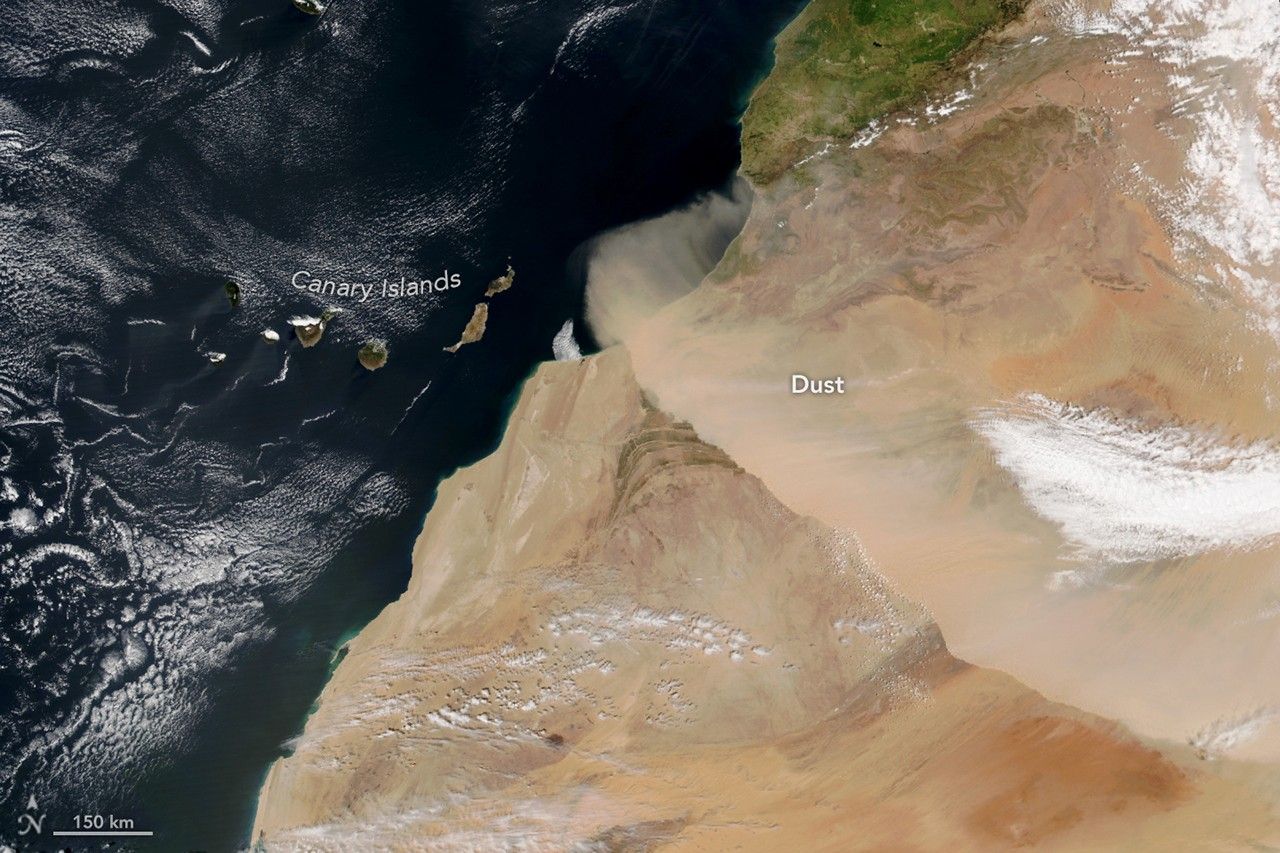
In early spring 2026, a dry, dust-laden wind known as the harmattan swept across northwestern Africa. Cold temperatures, high winds, and blowing dust prompted officials to issue an alert for several regions of Morocco due to the low visibility and harsh conditions.
Satellites tracked the wall of dust over the course of the day on March 30 as it moved southwest from the Sahara Desert and toward the Atlantic Ocean. The left image, captured by NASA’s Terra satellite, shows the dust at about 10:00 Universal Time (11 a.m. local time in Morocco). The NOAA-21 satellite captured the right image about four hours later.
Meteosat-12, a satellite operated by the European Organization for the Exploitation of Meteorological Satellites (EUMETSAT), captured another view of the dust storm. The geostationary weather satellite showed the dust’s movement as it moved closer to the Canary Islands.
According to Spain’s state meteorological agency (AEMET), the harmattan winds blow from the northeast between November and April, often producing dust storms as winds lift dust particles from the Sahara. During the March 30 event, AEMET noted that conditions were right for a harmattan surge, which happens when winds get stronger near the ground with the passing of a cold front. That day, winds converged perpendicular to the High Atlas mountain range before shifting southwest.
Forecasts called for the Saharan dust to ultimately engulf the Canary Islands, triggering what islanders know as calima. The dust episode was expected to worsen air quality and visibility across the islands through April 1. A separate storm earlier in March also sent dust toward the Canaries, along with another plume that dispersed widely across Europe.
Researchers using NASA data have previously reported that the most intense Saharan dust storms occur in the spring, when dust is typically lifted from the sand seas, or ergs, of central North Africa and areas along the Mediterranean coast. In the warmer months, another peak occurs in the central Sahara.
NASA Earth Observatory images by Lauren Dauphin, using MODIS and VIIRS data from NASA EOSDIS LANCE, GIBS/Worldview, and the Joint Polar Satellite System (JPSS). Story by Kathryn Hansen.

References & Resources
- AEMET Divulga via X (2026, March 31) These satellite images show a surge of harmattan, a dust storm (haboob) generated by the harmattan wind from the region. Accessed March 31, 2026.
- CIRA Satellite Library (2026, March 30) Daily loop from: Meteosat-12. Accessed March 31, 2026.
- Fiedler, S. et al. (2015) The importance of Harmattan surges for the emission of North African dust aerosol. Geophysical Research Letters, 42 (21), 9495-9504.
- HESPRESS (2026, March 30) Morocco issues orange alert for cold weather, strong winds, and dust storms. Accessed March 31, 2026.
- NASA Earth Observatory (2026, March 12) Dust Outbreak Reaches Europe. Accessed March 31, 2026.
- Saleh, S.A. et al. (2025) A preliminary assessment of the spatial and temporal patterns of sand and dust storms over the Sahara. Scientific African, 28 (e02729).
You may also be interested in:
Stay up-to-date with the latest content from NASA as we explore the universe and discover more about our home planet.

Clouds of dust lofted from the Sahara Desert brought hazy skies and muddy rain to Western Europe.

An advancing cold front kicked up a sharp line of sand and other small particles that swept over the high…
Reed-covered mounds exposed by declining water levels reveal an unexpected network of freshwater springs that feed directly into the lake…
Godspeed, Artemis II!
2026-03-31 15:54

NASA astronaut Jessica Meir took this photo of an Artemis program patch floating in the International Space Station’s cupola. She posted it on X on March 30, 2026, with the following caption: “Our work on the @Space_Station has provided the foundation to explore further, preparing us to return humans to the Moon this week. Stay tuned as we enter the @NASAArtemis era! Expedition 74 will certainly be keeping a close watch. Godspeed, Artemis II!”
Image credit: NASA/Jessica Meir
Landsat Reveals Reservoir Changes and Bathymetry
2026-03-31 14:30
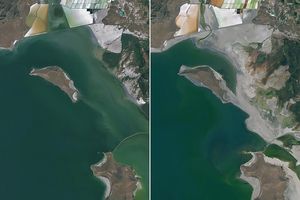
Communities worldwide rely on reservoirs for drinking water, hydroelectric power, irrigation, and more. These critical freshwater resources are affected by seasonal and long-term changes; water levels in reservoirs can dip during hot summer months or due to prolonged drought, or can flood after a particularly strong storm. Despite their importance, there are key gaps in our knowledge of reservoir structure and dynamics. Two recent papers use Landsat data to help fill in those gaps.
Researchers from the University of Southampton used Landsat data to identify where water advanced or retreated from 1984 to 2022, creating the first global dataset pinpointing the exact year of permanent surface water changes—such as when a reservoir formed or a stream dried up. The study can track changes in streams as narrow as 30m and lakes as small as 900m2. In a separate study, Texas A&M University researchers used Landsat data to build a global bathymetry dataset called ‘3D-LAKES’ that enables water managers to estimate reservoir storage capacity.
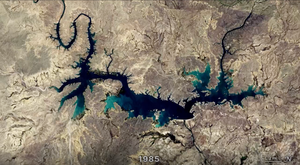
The above animation shows the Amistad Reservoir on the border of Texas and Mexico. It uses a natural-color Landsat image from 1985 overlaid onto a Copernicus Digital Elevation Model (DEM) and bathymetric data from the 3D-LAKES dataset. Vertical relief is exaggerated by a factor of four to emphasize topographic features and landforms. The reservoir is jointly managed by the U.S. and Mexico through the International Boundary and Water Commission (IBWC) for flood control, recreation, and hydroelectric power. Despite its importance to the two countries, the reservoir is slowly shrinking. The surface water transitions dataset shows the water levels retreating in recent decades, with significant recessions between 2012 and 2016. The 3D-LAKES dataset reveals the underwater shape of the reservoir. Together, these datasets complement the in situ water level and conditions data collected throughout the year.
Tracking Surface Water Transitions
Human communities both shape and are shaped by water. We divert rivers, build reservoirs, and construct artificial islands, while natural forces—storms, meandering rivers, and rising seas—reshape our waterways and coastlines. With satellite data as an important tool to study ecosystem dynamics, researchers have begun to build a more comprehensive global understanding of where water is and how it shifts over time. In their water transitions study, the University of Southampton team focused specifically on permanent changes in lakes, rivers, coastlines, and other water bodies worldwide.
Looking at long-term changes in surface water can help scientists understand drivers of change, said Gustavo Willy Nagel, lead researcher on the paper. Knowing when a lake began receding helps water managers investigate whether drought, irrigation, or other forces caused the decline.
Scientists, policymakers, and water managers can explore the interactive dataset that Nagel and his team created to visualize changes close to home as well as stark global impacts such as the drying of the Aral Sea, the lakes created by melting glaciers in Tibet, and the building of the Palm Islands in Dubai.
Assessing long-term changes in surface water presents a key challenge, as surface water is extremely dynamic. Seasonal fluctuations and climatic forces mean that rivers, lakes, and coastlines are changing all the time. To identify permanent water changes while excluding seasonal fluctuations, the researchers ran two algorithms. The first detected whether the water body was advancing or retreating over the study period using the Modified Normalized Difference Water Index (mNDWI), which uses the shortwave-infrared (SWIR) instead of the near-infrared (NIR) band. The second algorithm used the Green_Red Normalized Difference Water Index (grNDWI)—an index proposed by the research team—to identify the precise year that the water body transitioned. A change was considered “permanent” if it did not revert to its previous condition during the study period of 1984 to 2022.
“The dataset is showing, for every location on the planet, areas where water advanced or retracted and the year of that change,” said Nagel.
Visualizing Lakes in 3D
Landsat can help us monitor surface water. But what about what’s under the surface?
In a study published in Scientific Data in October 2025, researchers from Texas A&M University fused Landsat and ICESat-2 data to create bathymetry maps for half a million global lakes and reservoirs. The research team, led by Huilin Gao, used Landsat imagery to calculate the surface area of water bodies, delineate where water meets land, and track how water extent changes over time. Then, they combined laser altimetry from the ICESat-2 satellite to infer the underwater bathymetry of water bodies. With these measurements, the scientists refined area-elevation relationships, a key metric for understanding how water storage changes with water level.

The resultant dataset, dubbed 3D-LAKES, is static, as bathymetry does not tend to change significantly year to year. “This dataset can support many applications, from monitoring water storage to refining hydrological models,” said Chi-Hsiang Huang, the study’s lead author.
3D-LAKES can be used in combination with Landsat-based maps—like the surface transition research or the popular Global Surface Water dataset—to help water resource managers assess the volume of water held in a reservoir or lake. This allows them to evaluate flood risk, map habitat, or calculate how much water is available during a particularly dry season. Researchers can also track changing water volume over time, helping understand long-term trends in water storage.
Measuring underwater topography has historically been expensive and impractical at global scales. The 3D-LAKES dataset now provides researchers and managers with crucial bathymetric data for lakes and reservoirs worldwide. “With this new dataset, we can achieve a more comprehensive understanding of the impacts of lakes and reservoirs on regional climatology, water security, and ecosystem services,” said Gao. Both studies provide water and land managers with unprecedented tools for resource management and planning—from the Amistad Reservoir to the Australian Outback to the Brazilian Amazon.
Explore More
In two recent studies, researchers used Landsat data to fill key gaps in our knowledge of reservoir structure and dynamics.

A network of meltwater lakes and drainage channels made an Antarctic ice shelf known for its blue ice areas even…
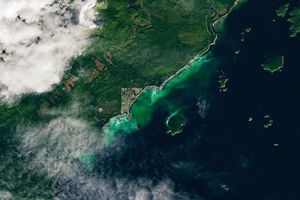
The activity of herring around Vancouver Island in British Columbia brightened coastal waters enough to be detectable from space.
TechCrunch - Latest
De-fi platform Drift suspends deposits and withdrawals after millions in crypto stolen in hack
2026-04-01 22:58
Anthropic took down thousands of GitHub repos trying to yank its leaked source code — a move the company says was an accident
2026-04-01 22:12
The reputation of troubled YC startup Delve has gotten even worse
2026-04-01 21:23
‘System failure’ paralyzes Baidu robotaxis in China
2026-04-01 21:12
A new dating app, Sonder, has a deliberately annoying sign-up process (and it’s working)
2026-04-01 20:46
